50 source-backed statistics | U.S. research with 2025 South Carolina comparisons | Updated November 2026
Health insurance and employee benefits statistics show how many employers offer coverage, how often employees enroll, and how costs are shared. According to KFF’s 2026 Employer Health Benefits Survey, average annual family premiums reached $28,303, with workers contributing $7,471.
This 2027 edition brings together 50 statistics covering employer-sponsored health insurance, premiums, enrollment, ICHRA, group life and disability insurance, and South Carolina comparisons. Drawing on the latest available research, primarily from 2025 and 2026, each finding includes its reporting year, supporting source, and context to help readers understand the data accurately.
Health Insurance & Employee Benefits: Key Statistics
| Family premium | Worker family contribution | Employers offering benefits |
| $28,303 | $7,471 | 67% of firms with 10+ workers |
Source: KFF — 2026 Employer Health Benefits Survey (2026 data).
Employer-Sponsored Health Insurance Coverage Statistics
Employment-based health coverage is the leading type of insurance coverage in the United States. The measures below describe different populations: people with coverage, firms offering benefits, and employees working for those firms. They should not be used interchangeably.
How Many Americans Have Employment-Based Health Insurance?
- Employment-based insurance covered 53.5% of the U.S. population for some or all of 2025. The Census Bureau’s measure includes covered workers and eligible family members. It does not mean that 53.5% of employers offered a plan. The source is the 2025 Current Population Survey Annual Social and Economic Supplement, published in September 2026.
Source: U.S. Census Bureau — Health Insurance Coverage in the United States: 2025
- Employer-sponsored health insurance covered nearly 157 million people under age 65. KFF’s 2026 survey summary uses this estimate to describe the scale of job-based insurance among the nonelderly population. This is a different population and measurement from the Census figure above; the two numbers should not be used to calculate a combined total.
Source: KFF — 2026 Employer Health Benefits Survey
What Percentage of Employers Offer Health Insurance?
- In 2026, 67% of U.S. firms with at least 10 workers offered health benefits. KFF’s employer survey excludes firms with fewer than 10 workers. Its methodology changed in 2025, so unadjusted offer rates from earlier surveys are not directly comparable with this estimate.
Source: KFF — 2026 Employer Health Benefits Survey
- Among firms with 200–999 workers, 98% offered health benefits in 2026. The figure applies to firms in this specific employment-size group, not to all employers. It illustrates how offer rates differ by workforce size.
Source: KFF — 2026 Employer Health Benefits Survey
- More than 99% of firms with 1,000 or more workers offered health benefits in 2026. KFF reports this as over 99%, rather than an exact 100%. It describes whether a firm offers health benefits to at least some employees, not whether every worker is eligible.
Source: KFF — 2026 Employer Health Benefits Survey
- About 92% of workers were employed by a firm that offered health benefits in 2026. This worker-weighted measure is much higher than the share of firms offering insurance because firms with many workers are more likely to provide coverage. Being employed at an offering firm does not establish that a particular worker enrolled.
Source: KFF — 2026 Employer Health Benefits Survey
Employee Health Insurance Eligibility and Participation Statistics
An employer can offer insurance without every worker qualifying for or choosing it. Eligibility, take-up, and employee benefits enrollment answer separate questions; the denominator matters for each one.
How Many Employees Are Eligible for Employer Health Coverage?
- An average of 80% of workers at firms offering health coverage were eligible for it in 2026. KFF’s eligibility rate applies to workers at firms that offer benefits. Reasons some employees are ineligible include part-time status, temporary employment, or waiting periods.
Source: KFF — 2026 Employer Health Benefits Survey
- The eligibility rate was 73% at firms with relatively large shares of lower-wage workers. KFF defines these firms as those where at least 35% of workers earned $38,000 or less annually. Firms with smaller shares of lower-wage workers had an 81% eligibility rate. These are survey categories, not a universal wage-based eligibility rule.
Source: KFF — 2026 Employer Health Benefits Survey
- In retail firms offering coverage, the average worker eligibility rate was 61% in 2026. KFF identifies retail as an industry with relatively low eligibility in its survey. The figure is not the percentage of all retail employees who have any type of health insurance.
Source: KFF — 2026 Employer Health Benefits Survey
What Percentage of Eligible Employees Enroll?
- Of workers eligible for their employer’s health plan, 74% enrolled in 2026. This is KFF’s take-up rate among eligible workers at firms offering health benefits. Workers may choose other sources of coverage or decline coverage for other reasons.
Source: KFF — 2026 Employer Health Benefits Survey
- At firms offering health benefits, 59% of all workers were covered by their own employer’s plan. KFF counts both workers who were ineligible and eligible workers who did not enroll in the denominator for this coverage rate. It should not be described as the percentage of eligible workers who enroll.
Source: KFF — 2026 Employer Health Benefits Survey
- Across all firms, including those not offering benefits, 55% of workers were covered by their own employer in 2026. This wider denominator helps explain the difference between being employed, working at an employer that offers a plan, and receiving coverage from that employer.
Source: KFF — 2026 Employer Health Benefits Survey
- Among private-industry workers, 71% had access to medical benefits and 46% participated in March 2026. The BLS National Compensation Survey uses all workers in private industry as the denominator. Its survey design differs from KFF’s employer survey, so these measures should be presented separately, not merged into a calculation with KFF figures.
Source: U.S. Bureau of Labor Statistics — Employee Benefits, March 2026 (tables)
- Medical benefit access was 87% for full-time private-industry workers but 23% for part-time workers. These March 2026 BLS rates show that access varies substantially by work status. Access means a benefit is available, not that the worker enrolls.
Source: U.S. Bureau of Labor Statistics — Employee Benefits, March 2026 (tables)
Employer Health Insurance Premium Statistics
Premiums are the cost of coverage before splitting the bill between employers and workers. KFF’s 2026 figures are averages across covered workers at surveyed firms with at least 10 employees; they are not quotes for a particular company.
- The average annual premium for employer-sponsored single health coverage was $9,804 in 2026. KFF reports the total premium for a worker with single coverage, including employer and worker contributions. The average is not the same as an employee’s paycheck deduction.
Source: KFF — 2026 Employer Health Benefits Survey
- The average annual premium for employer-sponsored family coverage reached $28,303 in 2026. This includes the employer and employee portions of the premium. KFF published the 2026 results on October 22, 2026.
Source: KFF — 2026 Employer Health Benefits Survey
- Average employer-sponsored single and family premiums each rose 5% from 2025 to 2026. KFF reports the same percentage increase for both coverage tiers. Premium growth is a change in the surveyed average, not a prediction of any individual employer’s renewal.
Source: KFF — 2026 Employer Health Benefits Survey
Employer and Employee Health Insurance Contributions
- Workers paid an average of $1,672 annually toward single coverage premiums in 2026. This is the average employee contribution, not the total $9,804 premium. Dividing the annual figure by 12 gives approximately $139 per month, consistent with KFF’s reported monthly amount.
Source: KFF — 2026 Employer Health Benefits Survey
- Workers contributed an average of $7,471 toward family premiums in 2026. KFF reports an increase of $621, or 9%, from 2025. The overall family premium was $28,303, illustrating that worker contributions and total premiums are separate measures.
Source: KFF — 2026 Employer Health Benefits Survey
- On average, covered workers contributed 18% of single premiums and 27% of family premiums in 2026. These percentages are KFF’s worker contribution shares, not employee participation rates. The corresponding employer shares vary among firms and plans.
Source: KFF — 2026 Employer Health Benefits Survey
Health Insurance Contributions by Employer Size
- For family coverage, workers at firms with 10–199 workers paid 37% of premiums, versus 25% at larger firms. KFF categorizes larger firms as those with 200 or more workers. These contribution shares are averages for covered workers in the relevant firm-size groups.
Source: KFF — 2026 Employer Health Benefits Survey
- Average annual family premium contributions were $9,687 at smaller firms and $6,840 at larger firms. The $2,847 difference is an observed difference between group averages. It should not be interpreted as a guaranteed savings from working at a larger employer.
Source: KFF — 2026 Employer Health Benefits Survey
- Average family premiums were $27,288 at firms with 10–199 workers and $28,592 at larger firms. The lower average total premium at smaller firms occurs alongside higher average worker family contributions. This illustrates why total premiums and worker cost-sharing should be examined together.
Source: KFF — 2026 Employer Health Benefits Survey
Table 1. 2026 Annual Health Insurance Premiums and Contributions
| Coverage | Average total premium | Worker contribution | Employer portion* |
| Single | $9,804 | $1,672 | $8,132 |
| Family | $28,303 | $7,471 | $20,832 |
Employer portion calculated as the difference between two KFF-weighted averages; not a direct quote for any employer. KFF 2026.
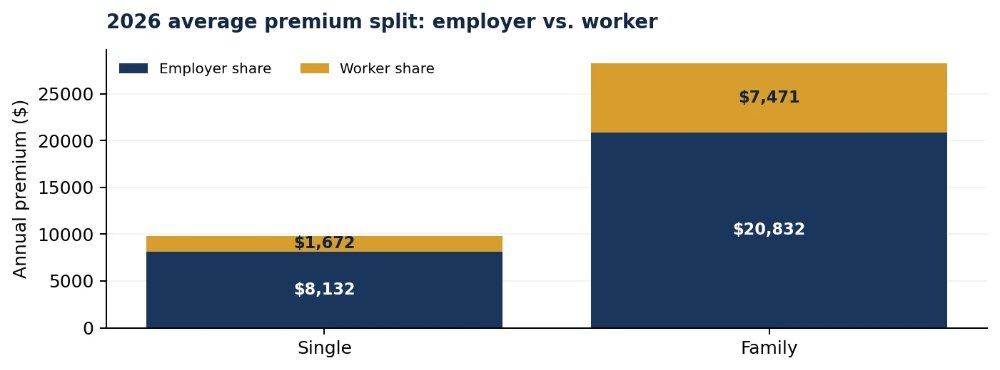
Figure 1. Premium split; original data: KFF 2026 survey.
Health Insurance Deductible and Group Plan Statistics
Premiums describe the cost of having a plan; deductibles and other cost sharing describe some of what people may pay when they use care. Health plan type and funding arrangement are also different concepts.
Average Deductibles and Cost-Sharing Trends
- In 2026, 88% of covered workers had a plan with a general annual deductible for single coverage. A deductible is an amount paid by the member before many covered services are paid for by the plan, subject to plan terms. KFF’s figure does not mean that every service is subject to that deductible.
Source: KFF — 2026 Employer Health Benefits Survey
- The average general annual single deductible among workers in plans with a deductible was $1,955 in 2026. This average excludes covered workers enrolled in plans without a general annual deductible. It should not be called the average deductible for every covered worker.
Source: KFF — 2026 Employer Health Benefits Survey
- For workers with a general deductible, the average single deductible was $2,624 at smaller firms and $1,772 at larger firms. KFF groups firms by 10–199 workers versus 200 or more. These weighted averages describe plan designs, not the actual annual medical costs incurred by each worker.
Source: KFF — 2026 Employer Health Benefits Survey
- About 38% of covered workers faced a general annual single deductible of at least $2,000 in 2026. This estimate refers to covered workers and a deductible threshold for single coverage. It is distinct from an out-of-pocket maximum.
Source: KFF — 2026 Employer Health Benefits Survey
Self-Funded, Fully Insured, and High-Deductible Health Plan Statistics
- Preferred provider organization plans enrolled 50% of covered workers in 2026. KFF’s PPO measure describes plan type, which concerns network and referral arrangements; it does not reveal whether the plan is self-funded or fully insured.
Source: KFF — 2026 Employer Health Benefits Survey
- HSA-qualified plans enrolled 29% of covered workers in 2026. HSA-qualified means a high-deductible plan that meets federal criteria allowing eligible participants to contribute to a health savings account. KFF changed how HRA-linked plans are classified in 2026, which matters when comparing historical plan shares.
Source: KFF — 2026 Employer Health Benefits Survey
- Self-funded health plans covered 71% of covered workers in 2026. Under a self-funded arrangement, an employer generally bears direct financial responsibility for covered medical claims, often using an administrator. This is a funding measure, not a PPO/HMO plan-type share.
Source: KFF — 2026 Employer Health Benefits Survey
- Self-funded enrollment was 85% at firms with 200 or more workers, compared with 25% at firms with 10–199 workers. KFF reports this substantial funding-arrangement difference by employer size. Level-funded products are also discussed separately in its methodology.
Source: KFF — 2026 Employer Health Benefits Survey
- Some 37% of firms with 10–199 workers offering benefits reported offering a level-funded plan in 2026. A level-funded arrangement typically combines a nominally self-funded plan with stop-loss coverage and administration. KFF notes that employer responses may differ because these arrangements can be difficult to classify.
Source: KFF — 2026 Employer Health Benefits Survey
ICHRA and Account-Based Health Benefits Statistics
Individual Coverage Health Reimbursement Arrangements (ICHRAs) are employer-funded arrangements that can help reimburse qualifying individual-market health insurance expenses. They are not the same as traditional group health plans or health savings accounts. Surveyed interest should never be represented as actual adoption.
ICHRA Employer Awareness and Adoption Interest
- One in three employers already offering health benefits said they were likely to adopt an ICHRA within two years. This July 2026 EBRI–Morgan Health employer-survey result measures stated likelihood, not a documented decision to implement an ICHRA. The proportion should not be used to forecast actual national market adoption.
Source: EBRI & Morgan Health — 2026 Employer ICHRA Survey
- Among smaller employers not offering coverage, 55% were unaware that ICHRAs were an option. The 2026 EBRI–Morgan Health result describes awareness within a defined survey group. It is not a measure of how many employers offer or enroll workers in ICHRAs.
Source: EBRI & Morgan Health — 2026 Employer ICHRA Survey
- Among surveyed employers with 100 or more employees, 62% expressed a likelihood of adopting an ICHRA within two years. EBRI reported the highest expressed interest within this employer-size group. The finding is about intentions among survey respondents, not expected future adoption with certainty.
Source: EBRI & Morgan Health — 2026 Employer ICHRA Survey
Health Savings Accounts and Health Reimbursement Arrangements
- Average employer HSA contributions for family coverage reached $1,346 annually in 2026. This average likewise includes covered workers with zero employer HSA contributions. A health savings account (HSA) is owned by the employee, while a health reimbursement arrangement is typically employer-funded.
Source: KFF — 2026 Employer Health Benefits Survey
- Employers contributed an average of $713 annually to HSAs for single coverage among covered workers in HSA-qualified plans. KFF’s average includes workers receiving no employer contribution. It is a contribution to a health savings account, separate from the employer’s payment toward plan premiums.
Source: KFF — 2026 Employer Health Benefits Survey
- Average employer HSA contributions for family coverage reached $1,346 annually in 2026. This average likewise includes covered workers with zero employer HSA contributions. An HSA is owned by the employee, while a health reimbursement arrangement is typically employer-funded.
Source: KFF — 2026 Employer Health Benefits Survey
Group Life, Disability, and Voluntary Benefits Statistics
Employer benefits extend beyond major medical insurance. The BLS National Compensation Survey provides a consistent way to compare how often selected insurance benefits are available and used by workers.
Group Life and Disability Insurance Participation
- Life insurance was available to 59% of private-industry workers in March 2026. The BLS measures whether a life insurance plan was available at work, not the percentage of Americans owning an individual life insurance policy.
Source: U.S. Bureau of Labor Statistics — Employee Benefits, March 2026 (tables)
- About 58% of private-industry workers participated in employer life insurance plans in March 2026. BLS reports a 98% take-up rate among those with access. Access and participation are separate measures even when they are close for a particular benefit.
Source: U.S. Bureau of Labor Statistics — Employee Benefits, March 2026 (tables)
- Short-term disability coverage was available to 44% of private-industry workers in March 2026. This BLS measure concerns employer-provided access to a short-term disability plan, not the share of employees who filed disability claims.
Source: U.S. Bureau of Labor Statistics — Employee Benefits, March 2026 (tables)
- Long-term disability coverage was available to 37% of private-industry workers in March 2026. BLS reports this separately from short-term disability access because the plans cover different benefit periods and may have different eligibility rules.
Source: U.S. Bureau of Labor Statistics — Employee Benefits, March 2026 (tables)
Voluntary and Supplemental Health Insurance Benefits
- Dental benefits were available to 44% of private-industry workers, and 32% participated in March 2026. These BLS figures describe employee access and participation, not employer adoption of a specific dental insurance carrier. Dental benefits are a directly relevant insurance-related offering.
Source: U.S. Bureau of Labor Statistics — Employee Benefits, March 2026 (tables)
- Vision benefits were available to 29% of private-industry workers, with 22% participating in March 2026. BLS counts workers with access and participation using its own definitions. These figures should not be used to infer enrollment in accident, critical illness, or other voluntary products.
Source: U.S. Bureau of Labor Statistics — Employee Benefits, March 2026 (tables)
Table 2. Employee Access to Selected Insurance Benefits, March 2026
| Benefit | Access, private industry | Participation, private industry |
| Life insurance | 59% | 58% |
| Dental | 44% | 32% |
| Vision | 29% | 22% |
| Short-term disability | 44% | Not separately stated here |
| Long-term disability | 37% | Not separately stated here |
Source: BLS National Compensation Survey, March 2026. Disability values shown are access rates, not participation estimates.
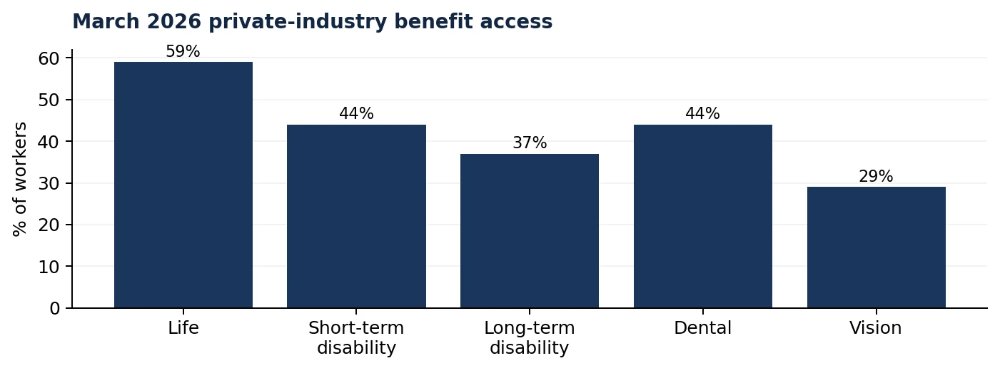
Figure 2. Access measures, not enrollment. Source: BLS 2026 tables.
Historical Health Insurance Trends and South Carolina Statistics
Historical comparisons should use matching sources and clearly state when the underlying data was measured. The national 2026 KFF survey and the 2025 AHRQ state dataset have different methods, so comparisons should stay within each dataset.
How Have Employer Health Insurance Premiums Changed Over Time?
- Average employer-sponsored family premiums were 28% higher in 2026 than in 2021. KFF’s comparison is based on nominal premium dollars. It is not an inflation-adjusted estimate, and it does not describe how much a particular employer’s costs increased.
Source: KFF — 2026 Employer Health Benefits Survey
- Average family premiums in 2026 were 55% higher than in 2016. KFF’s decade comparison uses the same employer health benefits research series. The change reflects premium growth in nominal terms, not an increase in coverage levels or health outcomes.
Source: KFF — 2026 Employer Health Benefits Survey
- The average single deductible among workers in plans with a deductible increased 34% from 2016 to 2026. KFF reports a rise from $1,464 in 2016 to $1,955 in 2026. This percentage applies to workers whose plans have a general annual deductible, not all covered workers.
Source: KFF — 2026 Employer Health Benefits Survey
South Carolina vs. U.S. Employer Health Insurance Statistics
For employers in Summerville, South Carolina, these statewide statistics provide useful context for understanding health insurance costs. However, the figures represent state and national averages, not the actual premiums paid by individual employers.
- The average annual employer-sponsored family premium in South Carolina was $25,046 in 2025, versus $26,281 nationally. These values come from AHRQ’s 2025 Medical Expenditure Panel Survey–Insurance Component (MEPS-IC) private-sector estimates as reproduced in KFF State Health Facts. They should not be compared directly to KFF’s separate 2026 survey average of $28,303.
Source: KFF — 2025 Family Premiums | Original: AHRQ 2025 MEPS-IC state and U.S. tables
- The average employee family-premium contribution was $8,269 in South Carolina in 2025, versus $7,314 nationally. Both 2025 figures come from the same AHRQ MEPS-IC state/national dataset, shown in KFF’s data table. Differences between these averages do not establish the cost for an individual South Carolina business.
Source: 2025 Family Premiums | Original: AHRQ 2025 MEPS-IC state and U.S. tables
- The average annual single premium was $8,552 in South Carolina versus $9,025 nationally in 2025. The figures come from the same AHRQ MEPS-IC reporting year, reproduced in KFF’s 2025 state indicator. Use state comparisons within that source rather than mixing them with the 2026 KFF employer survey.
Source: KFF — 2025 Single Premiums | Original: AHRQ 2025 MEPS-IC state and U.S. tables
Table 3. South Carolina vs. U.S. Employer-Sponsored Premiums (2025)
| 2025 premium measure | South Carolina | United States |
| Family total premium | $25,046 | $26,281 |
| Family worker contribution | $8,269 | $7,314 |
| Single total premium | $8,552 | $9,025 |
AHRQ 2025 MEPS-IC private-sector estimates as displayed in KFF family premiums and KFF single premiums. These are not KFF’s separate 2026 employer survey estimates.
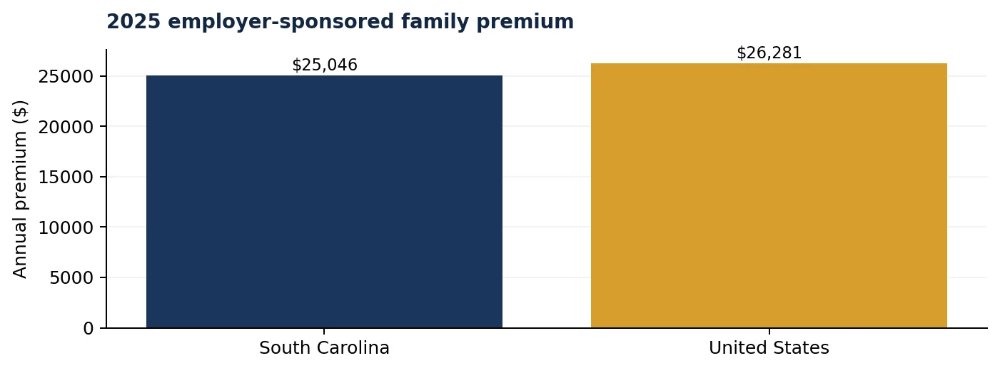
Figure 3. Comparable 2025 AHRQ-derived family-premium estimates. Primary table directory: MEPS-IC State Tables.
Research Methodology and Data Sources
This resource draws on KFF’s 2026 Employer Health Benefits Survey (covering firms with at least 10 employees), the U.S. Census Bureau’s 2025 health insurance coverage estimates, the Bureau of Labor Statistics’ March 2026 National Compensation Survey, the 2026 EBRI–Morgan Health ICHRA survey, and the Agency for Healthcare Research and Quality’s 2025 MEPS-IC state data. It is a compilation of original research, not a new Benni Agency employer survey.
Offer, access, eligibility, participation, take-up, and coverage rates refer to different denominators. Cost figures are population or survey averages rather than insurer quotations. Historical changes are nominal unless expressly indicated otherwise. South Carolina comparisons use AHRQ’s 2025 private-sector dataset as displayed in KFF State Health Facts, and should not be combined with KFF’s 2026 national premium estimates to infer a state growth rate.
KFF changed its survey sample frame in 2025 and its treatment of HRA-associated high-deductible plans in 2026. Related comparisons must use the adjusted KFF historical series and account for changes in classification. ICHRA awareness and intention figures describe survey responses rather than measured uptake. Sources and reporting periods should be rechecked each quarter when updated tables become available.