50 source-backed statistics | U.S. research and South Carolina data | Updated November 2026
Business insurance statistics show how often surveyed business owners report carrying coverage, how commercial insurance claims are changing, and what insurers report about premiums and losses. In a 2025 U.S. owner survey, 65% said they had general liability insurance; in Q3 2026, commercial auto renewal premium change averaged 3.63% in the Ivans Index.
This 2027 edition presents 50 business insurance statistics covering general liability, commercial auto, workers’ compensation, commercial property, business owners policies, cyber insurance, and professional liability. Based on research published through 2026, including data from 2024–2026, each finding includes its reporting period, original source, and context to help readers understand the figures.
Business Insurance Statistics: Key Statistics
| Measure | Scope |
| 65% | Surveyed owners reporting general liability insurance (2025) |
| $114,000 | Average general liability claim severity in Verisk’s 2025 reporting |
| 3.63% | Commercial auto renewal premium change, Ivans Q3 2026 |
| $1.145B | South Carolina commercial general liability earned premium (2024) |
Sources: Hiscox 2025; Verisk 2026; Ivans Q3 2026; South Carolina DOI 2026.
Business Insurance Coverage and Coverage Gap Statistics
The first question is what types of business insurance coverage owners report having, not how many policies insurers issue. Hiscox surveyed 2,000 U.S. owners of businesses with 1–50 employees between June 18 and 30, 2025. Its results describe those respondents; they are not a census of all U.S. businesses.
What Types of Business Insurance Do Business Owners Report Having?
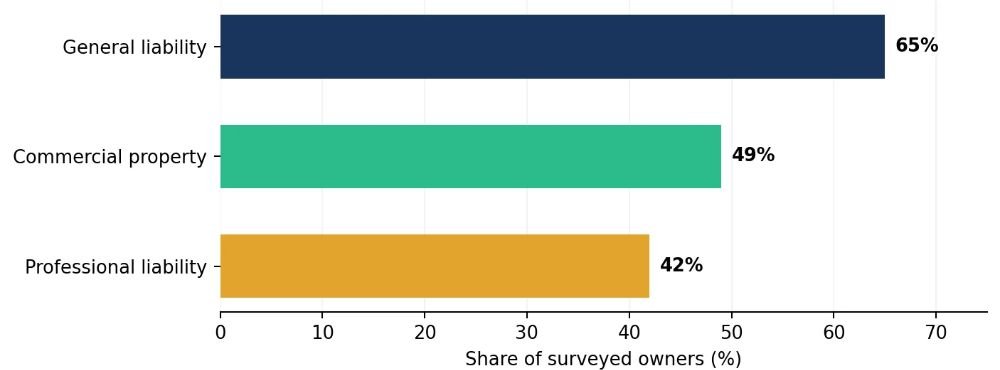
Figure 1. Types of coverage reported by Hiscox’s U.S. survey respondents (2025).
- In a 2025 U.S. owner survey, 65% reported carrying general liability insurance. The percentage reflects respondents in the Hiscox survey. It does not establish a nationwide adoption rate for every business, and a general liability policy is not a substitute for other commercial coverages.
Source: Hiscox — 2025 Underinsurance in Small Business Report
- Commercial property coverage was reported by 49% of surveyed business owners in 2025. Property coverage concerns business assets and is distinct from third-party general liability. Respondents could report more than one policy, so the ownership percentages should not be added.
Source: Hiscox — 2025 Underinsurance in Small Business Report
- Professional liability insurance was reported by 42% of surveyed owners in 2025. Professional liability addresses certain professional-service claims. Hiscox measured self-reported ownership in its 2,000-person U.S. survey, not a count of policies in force nationwide.
Source: Hiscox — 2025 Underinsurance in Small Business Report
How Common Are Business Insurance Coverage Gaps?
- Hiscox classified 77% of its U.S. survey respondents as underinsured in 2025. That assessment used seven study-defined criteria based on business activities and reported coverages. The classification is not an individual insurance audit or a legal judgment about coverage obligations.
Source: Hiscox — 2025 Underinsurance in Small Business Report
- Thirteen percent of the surveyed owners reported having no insurance at all. This refers to any reported business insurance in the Hiscox survey. It should not be confused with the share lacking one particular product, such as general liability.
Source: Hiscox — 2025 Underinsurance in Small Business Report
- Seventeen percent of surveyed owners were classified as having no core coverage in 2025. Hiscox treated “no core coverage” as a separate measure from having no insurance whatsoever. The report’s coverage categories and assessment rules matter when interpreting this figure.
Source: Hiscox — 2025 Underinsurance in Small Business Report
General Liability Insurance Statistics
General liability is one of the report’s priority commercial products. The evidence below separates survey-based ownership gaps, insurer claims results, and South Carolina market transactions. Those measures cannot be converted into one national adoption percentage.
General Liability Insurance Ownership and Coverage Gaps
- Twenty-two percent of Hiscox survey respondents lacked general liability insurance despite being assessed as needing it. “Needing it” was determined through the study’s criteria, including business activities. It does not mean 22% of all U.S. businesses are legally required to hold general liability insurance.
Source: Hiscox — 2025 Underinsurance in Small Business Report
- Twenty-one percent of surveyed owners were assessed as having general liability limits that were too low. Insufficient limits and missing coverage are different gaps. These categories may overlap and should not be summed to estimate the percentage of all businesses underinsured.
Source: Hiscox — 2025 Underinsurance in Small Business Report
- Seventy-four percent of surveyed owners did not understand that general liability addresses certain third-party bodily injury and property damage claims. This is a knowledge finding from Hiscox’s survey, not proof that those respondents lacked insurance. General liability does not automatically cover every business-property or professional-service loss.
Source: Hiscox — 2025 Underinsurance in Small Business Report
General Liability Claims and Insurance Loss Trends
- Verisk reported a 72% general liability loss ratio for 2025. Its June 2026 analysis summarizes 2021–2025 insurer experience in its reporting data. A loss ratio relates claim losses to earned premium; it does not mean 72% of insured businesses filed claims.
Source: Verisk — Executive Insights: General Liability (June 2026)
- Average general liability claim severity in Verisk’s 2025 data was $114,000. Verisk reported $100,000 for 2024, making the reported 2025 figure about 14% higher. The measure concerns claim severity in its dataset, not the average annual loss incurred by every business.
Source: Verisk — Executive Insights: General Liability (June 2026)
- Verisk reported general liability average premium increases of approximately 7% for a third consecutive year through 2025. This is an insurer-experience pricing trend summarized in the June 2026 report. It does not imply every employer or policy saw a 7% renewal increase.
Source: Verisk — Executive Insights: General Liability (June 2026)
- Commercial umbrella insurance had a five-year loss ratio of 92% in Verisk’s 2021–2025 analysis. Umbrella coverage is a separate liability layer. This insurer-reported loss ratio is included here to give context to broader liability exposure rather than to imply it is part of every general liability policy.
Source: Verisk — Executive Insights: General Liability (June 2026)
South Carolina General Liability Insurance Market Statistics
For businesses in Summerville, South Carolina, these statewide statistics provide useful context on commercial general liability insurance activity. However, the figures represent insurer-reported market data across South Carolina, not the number of businesses insured in Summerville.
- South Carolina insurers reported 116,620 new commercial general liability policies written in 2024. The South Carolina Department of Insurance compiled insurer submissions covering 2015–2024. New policy transactions are not the same as unique insured companies.
Source: South Carolina DOI — Commercial Liability Market Report (Jan. 2026)
- Insurers reported 213,037 commercial general liability renewal policies in South Carolina in 2024. Renewals may involve businesses counted in other periods. They should not be added to new policy counts to estimate the number of distinct firms with coverage.
Source: South Carolina DOI — Commercial Liability Market Report (Jan. 2026)
- Commercial general liability earned premiums reached $1,145.3 million in South Carolina in 2024. The same reporting series recorded $602.9 million in 2015. The increase represents reported insurer premium volume, not an increase in the price of a typical company’s policy.
Source: South Carolina DOI — Commercial Liability Market Report (Jan. 2026)
- The number of insurers writing South Carolina commercial general liability increased to 134 in 2024. There were 97 market participants in 2015 under the report’s definitions. The change describes insurers participating in the market, not the number of businesses insured.
Source: South Carolina DOI — Commercial Liability Market Report (Jan. 2026)
Table 1. South Carolina General Liability Market, 2015 vs. 2024
| Measure | 2015 | 2024 |
| New policies written | 81,423 | 116,620 |
| Renewal policies written | 151,210 | 213,037 |
| Earned premiums | $602.9 million | $1,145.3 million |
| Insurer participants | 97 | 134 |
Derived comparison: ($1,145.3M − $602.9M) ÷ $602.9M × 100 ≈ 90.0% growth in reported earned-premium volume, not an individual policy-price change.
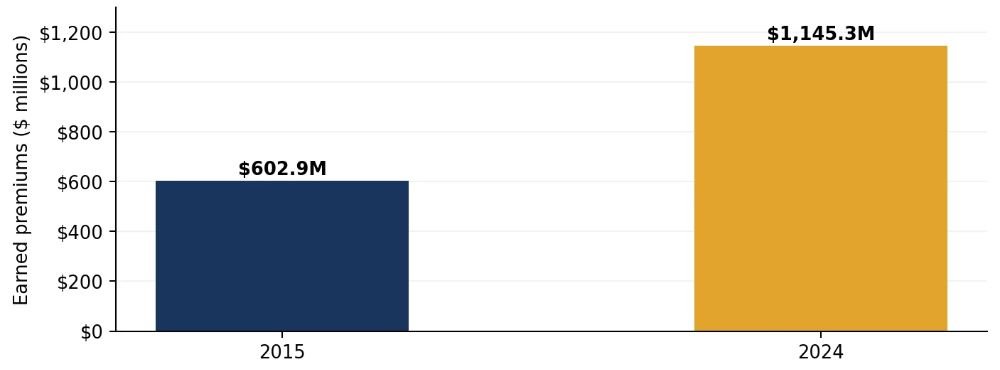
Figure 2. South Carolina commercial general liability earned premiums, 2015 and 2024.
Commercial Auto Insurance Statistics
Commercial auto data comes from insurer renewal activity, claims experience, and—where identified separately—the trucking sector. Personal-auto losses, total road crashes, and commercial-auto insurance claims are not interchangeable.
Commercial Auto Insurance Premium and Renewal Trends
- Commercial auto premium renewal rate change averaged 3.63% in Q3 2026 in the Ivans Index. That was down from 4.93% in Q2 2026. Ivans measures the year-over-year premium difference for a consistent policy in its participating network, not an average dollar premium for all commercial vehicles.
Source: Ivans Index — Q3 2026 Results (Oct. 2026)
Commercial Auto Claims and Loss Severity Statistics
- Verisk reported a 69% commercial auto loss ratio for the latest four quarters ending Q1 2026. The September 2026 report covers data from Q2 2021 through Q1 2026. The 69% ratio was six percentage points below the report’s five-year average.
Source: Verisk — Executive Insights: Commercial Auto (Sept. 2026)
- Average commercial auto claim severity reached $29,000 in the latest four-quarter period. Verisk reported $27,000 in the preceding four quarters. The difference reflects claim severity within the covered reporting data and should not be equated with average crash damage nationwide.
Source: Verisk — Executive Insights: Commercial Auto (Sept. 2026)
- Commercial auto claim severity was 51% higher in the latest four quarters than in the earliest four quarters of Verisk’s study. Verisk compared roughly $29,000 with approximately $19,000 across the reporting window. This is a period-to-period insurer claims comparison, not a price index.
Source: Verisk — Executive Insights: Commercial Auto (Sept. 2026)
Commercial Trucking Liability Insurance Costs
- Motor carrier liability insurance premium costs rose 18.6% from 2021 to 2024 in ATRI’s research. The research put those costs at 10.2 cents per mile in 2024. It covers trucking liability insurance economics; it does not establish a premium trend for all commercial auto policyholders.
Source: ATRI — Motor Carrier Insurance Research (May 2026)
- Per-mile liability losses among ATRI’s surveyed motor carriers increased an average of 33.1% from 2021 to 2024. This is a respondent-based measure of trucking liability losses, not a nationwide count of commercial auto insurance claims.
Source: ATRI — Motor Carrier Insurance Research (May 2026)
- Premium cost per mile for the $5-10 million trucking liability coverage layer rose 34% from 2021 to 2024. ATRI reported that the layer reached 1.58 cents per mile. Excess insurance layers have different limits and cannot be compared directly with primary commercial auto premiums.
Source: ATRI — Motor Carrier Insurance Research (May 2026)
- Premium cost per mile for the $5-15 million trucking liability layer increased 45% from 2021 to 2024. ATRI reported 1.05 cents per mile for this layer in 2024. The statistic applies to the study’s trucking context, not every business vehicle.
Source: ATRI — Motor Carrier Insurance Research (May 2026)
Workers’ Compensation Insurance Statistics
The National Council on Compensation Insurance (NCCI) publishes both calendar-year insurance results and accident-year claims estimates. Calendar-year premium and combined-ratio measures are different from lost-time claim frequency and severity.
Workers’ Compensation Premium and Market Statistics
- U.S. private-carrier workers’ compensation net written premium was about $41.6 billion in calendar year 2025. NCCI’s October 13, 2026 update describes final private-carrier countrywide figures; it reports a 0.2% decrease from 2024. State fund figures are outside this private-carrier total.
Source: NCCI — State of the Line Update (Oct. 2026)
- The 2025 workers’ compensation private-carrier combined ratio was 90.6%. A combined ratio compares insurer losses and operating expenses with premiums. The 2025 ratio represents an underwriting gain; it is not a share of employers with workers’ compensation claims.
Source: NCCI — State of the Line Update (Oct. 2026)
- Workers’ compensation private carriers recorded an 18.2% pretax operating gain for calendar year 2025. NCCI combines a 9.4% underwriting gain with an 8.8% investment gain on insurance transactions. This is a carrier performance indicator, not an employer return or a reduction in insurance costs.
Source: NCCI — State of the Line Update (Oct. 2026)
Workers’ Compensation Claim Frequency and Severity
- NCCI’s preliminary accident-year 2025 lost-time claim frequency estimate was 2% lower than in 2024. The series covers NCCI ratemaking jurisdictions and uses matched-state comparisons. It is a claim-frequency indicator, not the number of employees injured nationwide.
Source: NCCI — State of the Line Update (Oct. 2026)
- Preliminary workers’ compensation medical lost-time claim severity increased 4% for accident year 2025. NCCI’s October 2026 update retained its original estimate. Severity measures claim cost, not claim frequency, and the estimate is subject to later data revisions.
Source: NCCI — State of the Line Update (Oct. 2026)
- Preliminary workers’ compensation indemnity claim severity also increased 4% in accident year 2025. Indemnity severity concerns wage-replacement and related benefits in qualifying claims. The medical and indemnity changes are separate cost measures and should not be added together.
Source: NCCI — State of the Line Update (Oct. 2026)
Commercial Property and Business Owners Policy Statistics
A business owners policy (BOP) combines selected coverages, commonly commercial property and general liability, subject to the terms of the policy. Its insurance results differ from stand-alone property, general liability, or commercial multiperil reporting.
Business Owners Policy Premium and Claims Statistics
- Verisk’s 2025 businessowners loss ratio was 65%. The June 2026 Executive Insights report attributes the result partly to lower property claim frequency and improved liability experience. It is an insurer loss ratio, not a BOP adoption rate.
Source: Verisk — Executive Insights: Businessowners (June 2026)
- The five-year average businessowners loss ratio in Verisk’s 2021–2025 analysis was 83%. The 2025 ratio of 65% was 18 percentage points lower than this five-year average. Both figures come from Verisk’s reporting population rather than the complete U.S. insurer market.
Source: Verisk — Executive Insights: Businessowners (June 2026)
- Average businessowners claim severity was $74,000 in 2025. Verisk reported $65,000 in 2024, so the later figure was 15% higher. Claims severity here describes the source’s insurer claims experience, not the average cost of a BOP policy.
Source: Verisk — Executive Insights: Businessowners (June 2026)
- Verisk reported businessowners average premium increases above 10% for the third consecutive year from 2023 through 2025. This trend describes average premium changes in its data. It should not be interpreted as a uniform renewal increase for every policyholder.
Source: Verisk — Executive Insights: Businessowners (June 2026)
- Businessowners premium renewal rate change averaged 5.61% in Q3 2026 in Ivans data. The comparable Q2 2026 average was 6.16%. The businessowners index tracks renewal premium change, not the average amount businesses paid for BOP coverage.
Source: Ivans Index — Q3 2026 Results (Oct. 2026)
Commercial Property Insurance Market Statistics
- Commercial property premium renewal rate change averaged 5.65% in Q3 2026. Ivans reported 6.40% for Q2 2026. This is a consistent-policy renewal metric. A separate WTW insurer pricing survey also reported that commercial property had the largest price decrease among the lines it surveyed in Q2 2026; the methods differ.
Source: Ivans Index — Q3 2026 Results (Oct. 2026)
Property and BOP renewal rates should not be treated as an average cost per policy. WTW’s separate Q2 2026 insurer pricing survey found commercial property had the largest price decline among surveyed lines, illustrating how reports can differ because of methodology, sample and comparison period.
Cyber and Professional Liability Insurance Statistics
Cyber insurance and professional liability address different exposures. The original research below separates insurer premiums, policies, claims, and study-assessed coverage gaps; none of those measures can be substituted for a count of unique U.S. businesses insured.
Cyber Insurance Premium, Policy, and Claim Statistics
- U.S. cyber insurance direct written premium totaled approximately $9.46 billion in 2025. The NAIC figure includes alien surplus lines as well as domestic business. Direct written premium is a premium-volume measure, not a count of insurers or policyholders.
Source: NAIC — 2026 Report on the Cybersecurity Insurance Market
- U.S. cyber insurance direct written premium increased 3.5% from 2024 to 2025. The NAIC reported measured market growth despite moderating prices. Growth in premium volume can reflect multiple influences and does not by itself quantify business adoption.
Source: NAIC — 2026 Report on the Cybersecurity Insurance Market
- Domestic cyber insurers accounted for about $7.46 billion of written premium in 2025. The NAIC distinguishes this domestic figure from the $9.46 billion estimate that also includes alien surplus lines. Use the same market scope when comparing years.
Source: NAIC — 2026 Report on the Cybersecurity Insurance Market
- Domestic insurers reported 5.84 million cyber insurance policies in force in 2025. This count included policy endorsements and is not equivalent to 5.84 million distinct insured companies. A single business may have more than one relevant policy.
Source: NAIC — 2026 Report on the Cybersecurity Insurance Market
- The reported number of domestic cyber policies in force increased 33% in 2025. NAIC attributes much of the increase to cyber endorsements on other commercial policies. A policy-count change should not be described as the percentage increase in insured businesses.
Source: NAIC — 2026 Report on the Cybersecurity Insurance Market
- Insurers reported 56,323 cyber insurance claims for 2025. The NAIC count concerns reported insured claims, not every cyber incident suffered by U.S. organizations. The figure should be interpreted within the reporting-market scope.
Source: NAIC — 2026 Report on the Cybersecurity Insurance Market
- Reported cyber insurance claims increased 20% from 2024 to 2025. This is a year-over-year change in NAIC’s reported claims. It does not establish a 20% increase in cybercrime or in the number of businesses experiencing attacks.
Source: NAIC — 2026 Report on the Cybersecurity Insurance Market
- The cyber insurance loss ratio rose to 53 in 2025 from 48.7 in 2024. NAIC presents these as insurance loss-ratio values. They concern insurer claims relative to premiums, not the share of insured companies filing a claim.
Source: NAIC — 2026 Report on the Cybersecurity Insurance Market
Professional Liability Insurance Ownership and Coverage Gaps
- Twenty-five percent of Hiscox’s surveyed U.S. business owners lacked professional liability insurance despite being assessed as needing it. The study’s classification depends on business activities and its criteria for insurance need. The finding is not a national uninsured-business rate or a legal requirement for every company.
Source: Hiscox — 2025 Underinsurance in Small Business Report
Commercial Insurance Premium Trends by Coverage Type
The Ivans Index allows a consistent-policy comparison across six commercial lines. The figures below are average premium renewal rate changes for Q3 2026 within the reporting network, not changes in insurer premium revenue or universal rate changes for all policies.
Which Commercial Insurance Premium Renewal Rates Increased in 2026?
- General liability premium renewal rate change averaged 4.12% in Q3 2026. Ivans reported 5.44% for Q2 2026, indicating a slower positive renewal change in the following quarter. This is a quarter-level insurance renewal measure.
Source: Ivans Index — Q3 2026 Results (Oct. 2026)
- Umbrella liability premium renewal rate change averaged 6.88% in Q3 2026. Ivans reported 7.96% in Q2 2026. Umbrella was the highest positive renewal change among the six lines displayed in the Q3 comparison.
Source: Ivans Index — Q3 2026 Results (Oct. 2026)
- Workers’ compensation premium renewal rate change averaged −1.17% in Q3 2026. Ivans reported −1.37% in Q2 2026. A negative index value describes a lower average premium for consistent renewed policies within that network; it is not a national statutory rate change.
Source: Ivans Index — Q3 2026 Results (Oct. 2026)
- WTW’s insurer pricing survey reported a 0.5% aggregate U.S. commercial insurance price increase in Q2 2026. The comparison is with Q2 2025 for similar coverage and is based on participating insurers. WTW’s aggregate price measure should not be directly combined with Ivans’s Q3 consistent-policy renewal index.
Source: WTW — Commercial Lines Pricing Survey, Q2 2026
Table 2. Commercial Premium Renewal Rate Changes, Q3 2026
| Coverage | Q3 2026 renewal rate change |
| General liability | +4.12% |
| Commercial auto | +3.63% |
| Businessowners policy | +5.61% |
| Commercial property | +5.65% |
| Workers’ compensation | −1.17% |
| Umbrella | +6.88% |
Source: Ivans Index Q3 2026. Rates are not industry-wide premium revenue growth.
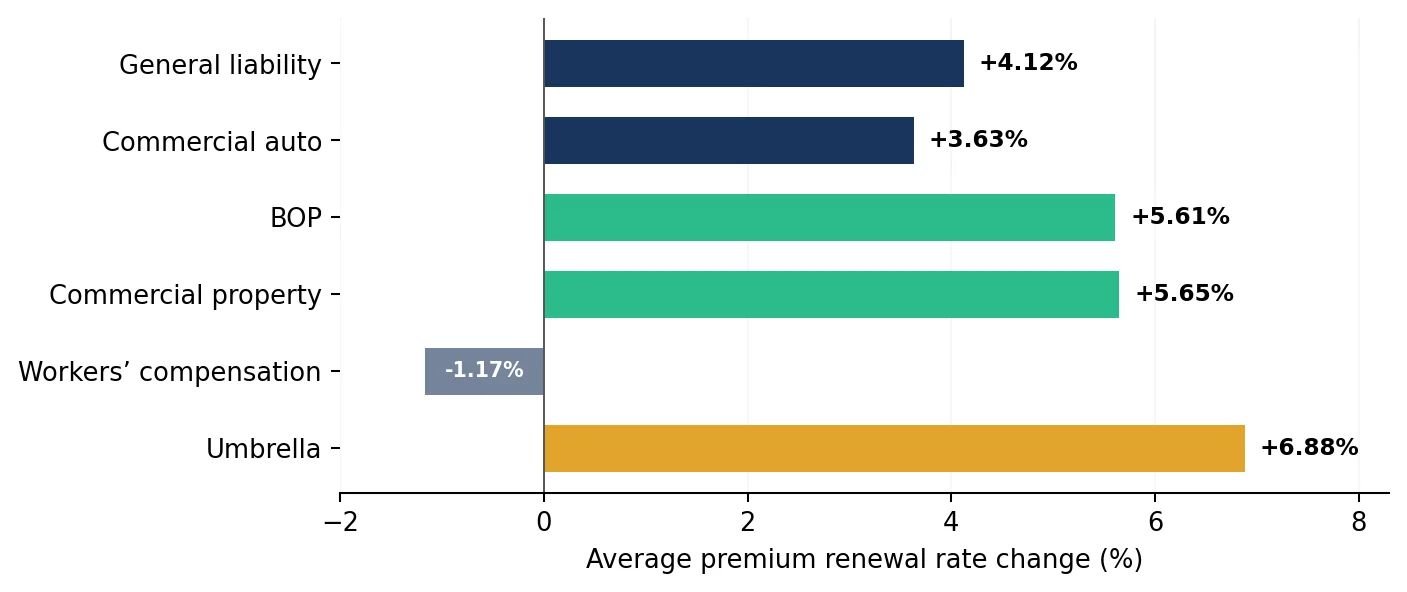
Figure 3. Ivans Index Q3 2026 commercial premium renewal changes.
About Our Research and Statistical Sources
This compilation uses original 2025–2026 industry studies, the January 2026 South Carolina Department of Insurance report (2015–2024 data), and official market reporting from Verisk, Ivans, NCCI, NAIC, ATRI, WTW and Hiscox. It is not a survey conducted by Benni Agency. Publication dates are not interchangeable with data reporting periods.
Hiscox surveyed 2,000 U.S. owners of businesses with 1–50 employees in June 2025 through an online research process. Its coverage and underinsurance percentages describe that survey sample and, for underinsurance, its seven assessment criteria. They must not be described as the percentage of all U.S. businesses holding or lacking a given policy.
South Carolina DOI policy counts measure new and renewal transactions reported by insurers, not the number of unique insured businesses. Premium volume, insurance renewal rate change, loss ratio, claim frequency and claim severity also measure different things. Verisk findings describe its contributing insurance experience; NCCI accident-year estimates are subject to revision. The NAIC cyber policy count includes endorsements and cannot be turned into a business-ownership rate.
Figures are intentionally grouped by specific insurance product rather than general business hazards. Cross-product comparisons are presented only when the underlying research uses a consistent definition or when differences are clearly disclosed. All links should be rechecked at least quarterly as source providers update reports, correct estimates, or change URLs.
Editorial note: This article provides general research information, not personalized insurance, legal or financial advice.